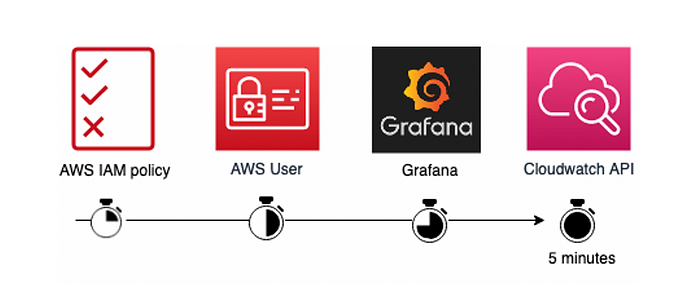
Grafana Cloud:
Grafana Cloud is a powerful and scalable monitoring platform that offers a wide range of monitoring options for your infrastructure, apps, and cloud resources.
Grafana Cloud allows you to combine all of your monitoring needs into a single platform, providing real-time visibility into the performance and health of your systems. The platform's clear UI and robust functionality make it an excellent choice for DevOps teams looking to efficiently monitor their surroundings.
Some key features and capabilities of Grafana Cloud include:
Metrics: Grafana Cloud offers fully managed Prometheus-compatible metrics storage and querying. Users can ingest metrics from various sources and visualize them using Grafana dashboards.
Logs: The platform provides scalable, high-performance, and durable log management, allowing users to ingest, search, and analyze their logs.
Traces: Grafana Cloud supports distributed tracing, enabling users to understand and troubleshoot complex, distributed applications.
Alerting: The platform includes a robust alerting system that can trigger notifications based on predefined rules and conditions.
Dashboards: Grafana Cloud provides a user-friendly dashboard builder, allowing users to create custom visualizations and dashboards for their observability data.
Integrations: Grafana Cloud integrates with a wide range of data sources, including Prometheus, Loki, Elasticsearch, and many others, making it easy to ingest and visualize data from various systems.
Scalability: The cloud-hosted nature of Grafana Cloud ensures automatic scaling and high availability, allowing users to easily handle growing volumes of observability data.
Security and Compliance: Grafana Cloud is designed with security and compliance in mind, providing features like role-based access control, audit logging, and support for various compliance standards.
Why do we use Grafana Cloud?
Using Grafana Cloud provides several benefits for organizations looking to enhance their observability and monitoring capabilities.
Operational Efficiency: Grafana Cloud is a fully managed service, meaning Grafana Labs handles the infrastructure, updates, scaling, and maintenance. This frees up internal teams to focus on their core business activities rather than managing monitoring infrastructure.
Reliability and Uptime: As a managed service, Grafana Cloud offers high availability and reliability, ensuring continuous monitoring without downtime.
Unified Platform: It integrates Grafana for visualization, Loki for logging, Prometheus for metrics, and Tempo for tracing. This unified approach allows teams to correlate data across metrics, logs, and traces, providing deeper insights into system performance and issues.
Elastic Scaling: Grafana Cloud can scale elastically to handle growing amounts of data and users, accommodating the needs of small teams as well as large enterprises.
User-Friendly Interface: Grafana's intuitive and customizable dashboards make it easy for users to create, explore, and share visualizations and insights.
Built-In Security: Grafana Cloud includes robust security features, such as data encryption, access controls, and compliance with industry standards, ensuring that sensitive data is protected.
Wide Range of Data Sources: Grafana Cloud supports numerous data sources, including cloud services, databases, and third-party monitoring tools. This flexibility allows organizations to integrate their existing systems seamlessly.
Alerting and Notifications: Advanced alerting capabilities ensure that users are promptly notified of any issues, with the ability to create complex alert rules and integrate with various notification channels.
Prerequisites
Before we know the implementation details, let's ensure we have the necessary prerequisites :
Step 1: An active AWS account with an EC2 instance provisioned.

Step 2: Docker is installed on the EC2 instance so that monitoring containers can operate.


Setup Grafana Monitoring for EC2 instance

Step 1: Set up the Grafana Cloud Console. If you haven’t set up Grafana Cloud yet, follow the steps in my previous blog on how to set up Grafana Cloud.
Step 2: On the Grafana Cloud home page, navigate to “Connections> Add new connection." Click on “AWS” to access the setup for AWS account integration.
Step 3: In the dashboard, select CloudWatch metrics for integration between AWS and Grafana Cloud.
Step 4: Create AWS IAM Role > For CloudWatch integration, you need to create an AWS IAM Role. Follow the given steps in the screenshot to set up the IAM Role via CloudFormation.
Step 5: Access the CloudWatch Metrics Dashboard > After successful integration, navigate to the home page and launch the dashboard. Choose the CloudWatch Metrics dashboard to get graphical data with real-time tracking.
Step 6: Set Up Alerts for CPU Utilization, Now we shall set up an alert for CPU utilization when it reaches 75%.
Click on “Create Alert Rule” for CPU utilization above 75%.
Select the metric as _ec2_cpuutilization_maximum, then select the instance ID, and set the threshold value to 75%.
Run the query to check the output and click on “Save Rule” to save the alert rule.
Step 7: Configure Alerting Emails , To receive alert notifications via email.
- Click on “Manage Contact Points.” Edit the grafana-default-email contact point.
Put your email address in the “Address” field and click “Test” for verification. and you will receive a test alert email to confirm the setup.
Step 8: Set Up Notification Policies
Click on “Manage Notification Policies.” Select the label and value for the notification (e.g., “alert” and “critical”).
Choose the contact point you previously created for alerting emails.
Step 9: Set Up Alerts for Billing In this step, we will set up an alert to avoid overspending on AWS services. We’ll create an alert if the estimated billing charges go above $10.
Select “Manage Alert Rule.”
Choose the metric
aws_billing_estimated_charges_averageand sum them. Now, Set the threshold value to 5$.Add a new notification policy for billing above $5.
Congratulations! You’ve now set up monitoring and alerting for your EC2 instances and AWS billing in Grafana Cloud. With Grafana Cloud’s powerful monitoring capabilities, you can proactively respond to issues and ensure the optimal performance of your infrastructure.
Thank you📖 for reading this Blog. If you found this ✨ helpful, please 👍like, 🌀share, and follow me for more blogs.
Happy Learning😊😊
Connect on 👉 chandana LinkedIn