Table of contents
- Grafana:
- Prometheus:
- cAdvisor:
- Tasks:
- Step 1: Install Docker and start docker service on a Linux EC2 through USER DATA.
- Step 2: Create adocker-compose.yml file with all the required containers
- Step 3: Configure Prometheus to Scrap Metrics
- Task-3:
- Now integrate the Docker containers and share the real-time logs with Grafana (your instance should be connected to Grafana, and the Docker plugin should be enabled on Grafana).
- Task-4:
- Check the logs or Docker container names on Grafana UI.
We have monitored ,😉 that you guys are understanding and doing amazing with monitoring tool. 👌
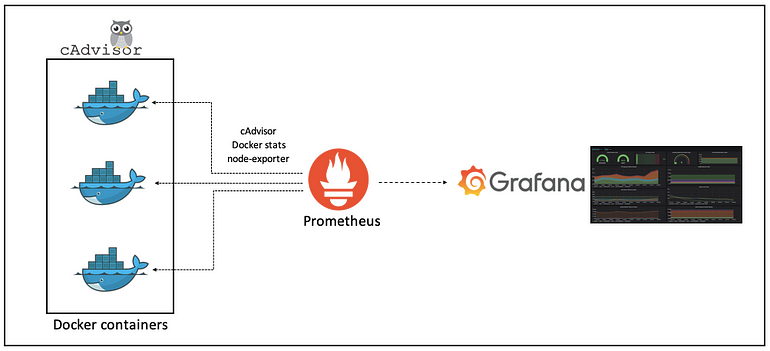
In this blog, we dive into how to effectively use these powerful tools to acquire insights into container performance indicators. cAdvisor for real-time container metrics, Prometheus for data aggregation and storage, and Grafana for insightful visualization. We’ll guide you through setting up a monitoring system for your Docker containers using Docker Compose.

Grafana:
Grafana is an open-source tool for performing data analytics, obtaining metrics that make sense of massive amounts of data, and monitoring our apps via easily configurable dashboards.
Grafana works with a variety of data sources, including Graphite, Prometheus, Influx DB, ElasticSearch, MySQL, PostgreSQL, and more. When connected to a supported data source, it displays web-based charts, graphs, and alerts.
Grafana allows you to query, view, and receive alerts on metrics and logs stored anywhere. This will be the primary and only web frontend through which you will access all of the backend applications listed in the subsequent tools' sections.
Prometheus:
Prometheus is an open-source monitoring and alerting solution that prioritizes dependability and scalability in modern, dynamic situations. Prometheus, created by the Cloud Native Computing Foundation, excels at collecting and storing time-series data, providing customers with useful insights into the performance and health of their applications and infrastructure.
cAdvisor:
cAdvisor (Container Advisor) is a tool provided by Google that provides insights into the resource usage and performance characteristics of running containers. It collects, aggregates, processes, and exports information about running containers. cAdvisor is designed for monitoring Docker containers and provides real-time resource usage data and performance metrics for containers.
Tasks:
Install Docker and start docker service on a Linux EC2 throughUSER DATA.
Create 2 Docker containers and run any basic application on those containers (A simple todo app will work).
Now intregrate the docker containers and share the real time logs with Grafana (Your Instance should be connected to Grafana and Docker plugin should be enabled on grafana).
Check the logs or docker container name on Grafana UI
Step 1: Install Docker and start docker service on a Linux EC2 through USER DATA.
How to Install it through USER DATA has been explained in this blog:
     #!/bin/bash

# Update the system
apt-get update
apt-get upgrade -y

# Install Docker dependencies
apt-get install -y apt-transport-https ca-certificates curl software-properties-common

# Add Docker's official GPG key
curl -fsSL https://download.docker.com/linux/ubuntu/gpg | sudo gpg --dearmor -o /usr/share/keyrings/docker-archive-keyring.gpg

# Add Docker repository
echo "deb [arch=amd64 signed-by=/usr/share/keyrings/docker-archive-keyring.gpg] https://download.docker.com/linux/ubuntu $(lsb_release -cs) stable" | sudo tee /etc/apt/sources.list.d/docker.list > /dev/null

# Update package information and install Docker
apt-get update
apt-get install -y docker-ce docker-ce-cli containerd.io

# Start Docker service
systemctl start docker

# Enable Docker to start on system boot
systemctl enable docker
Step 2: Create adocker-compose.yml file with all the required containers
Connect to your Ubuntu EC2 instance
I've chosen to create two containers. Code-Server, which is a containerized version of VS Code and Jenkins. The docker compose file also includes Grafana, Prometheus and cAdvisor. Create a
docker-compose.ymlfile with the following content:.
 version: "3"

 volumes:
   prometheus-data:
     driver: local
   grafana-data:
     driver: local

 services:
   # Grafana service
   grafana:
     image: grafana/grafana-oss:latest
     container_name: grafana
     ports:
       - "3000:3000"
     volumes:
       - grafana-data:/var/lib/grafana
     restart: unless-stopped

   # Prometheus service
   prometheus:
     image: prom/prometheus:latest
     container_name: prometheus
     ports:
       - "9090:9090"
     volumes:
       - /etc/prometheus:/etc/prometheus
       - prometheus-data:/prometheus
     command: "--config.file=/etc/prometheus/prometheus.yaml"
     restart: unless-stopped

   # Code-Server service
   code-server:
     image: lscr.io/linuxserver/code-server:latest
     container_name: code-server
     environment:
       - PUID=1000
       - PGID=1000
       - TZ=Etc/UTC
     volumes:
       - /etc/opt/docker/code-server/config:/config
     ports:
       - 8443:8443
     restart: unless-stopped

   # Jenkins service
   jenkins:
     image: jenkins/jenkins:lts
     container_name: jenkins
     privileged: true
     user: root
     volumes:
       - /etc/opt/docker/jenkins/config:/var/jenkins_home
       - /var/run/docker.sock:/var/run/docker.sock
       - /usr/local/bin/docker:/usr/local/bin/docker
     ports:
       - 8081:8080
       - 50000:50000
     restart: unless-stopped

   # cAdvisor service
   cadvisor:
     image: gcr.io/cadvisor/cadvisor:v0.47.0
     container_name: cadvisor
     ports:
       - 8080:8080
     network_mode: host
     volumes:
       - /:/rootfs:ro
       - /var/run:/var/run:ro
       - /sys:/sys:ro
       - /var/lib/docker/:/var/lib/docker:ro
       - /dev/disk/:/dev/disk:ro
     devices:
       - /dev/kmsg
     privileged: true
     restart: unless-stopped
Start the Docker containers by runningdocker compose up -d.

Step 3: Configure Prometheus to Scrap Metrics
Ensure your Ubuntu EC2 instance is connected to Grafana with the Prometheus data source configured as described in the previous article (#90DaysOfDevOps: Day 74: Connecting EC2 with Grafana).
Amend the prometheus.yml file as per below:
  global:
    scrape_interval:     15s # By default, scrape targets every 15 seconds.

    # Attach these labels to any time series or alerts when communicating with
    # external systems (federation, remote storage, Alertmanager).
    # external_labels:
    #  monitor: 'codelab-monitor'

  # A scrape configuration containing exactly one endpoint to scrape:
  # Here it's Prometheus itself.
  scrape_configs:
    # The job name is added as a label `job=<job_name>` to any timeseries scraped from this config.
    - job_name: 'prometheus'
      # Override the global default and scrape targets from this job every 5 seconds.
      scrape_interval: 5s
      static_configs:
        - targets: ['172.31.0.36:9090']

    # Example job for node_exporter
  #  - job_name: 'node_exporter'
  #    static_configs:
  #      - targets: ['172.31.0.58:9100', '172.31.0.36:9100']

    # Example job for cadvisor
    - job_name: 'cadvisor'
      static_configs:
        - targets: ['172.31.0.36:8080']
Restart Prometheus and access its dashboard to check if it can connect to the target nodes.

Task-3:
Now integrate the Docker containers and share the real-time logs with Grafana (your instance should be connected to Grafana, and the Docker plugin should be enabled on Grafana).

Access the Grafana Dashboard by using the instance IP address with port 3000
Select Dashboard Click on the + sign at the top right and choose Import
Navigating Dashboard


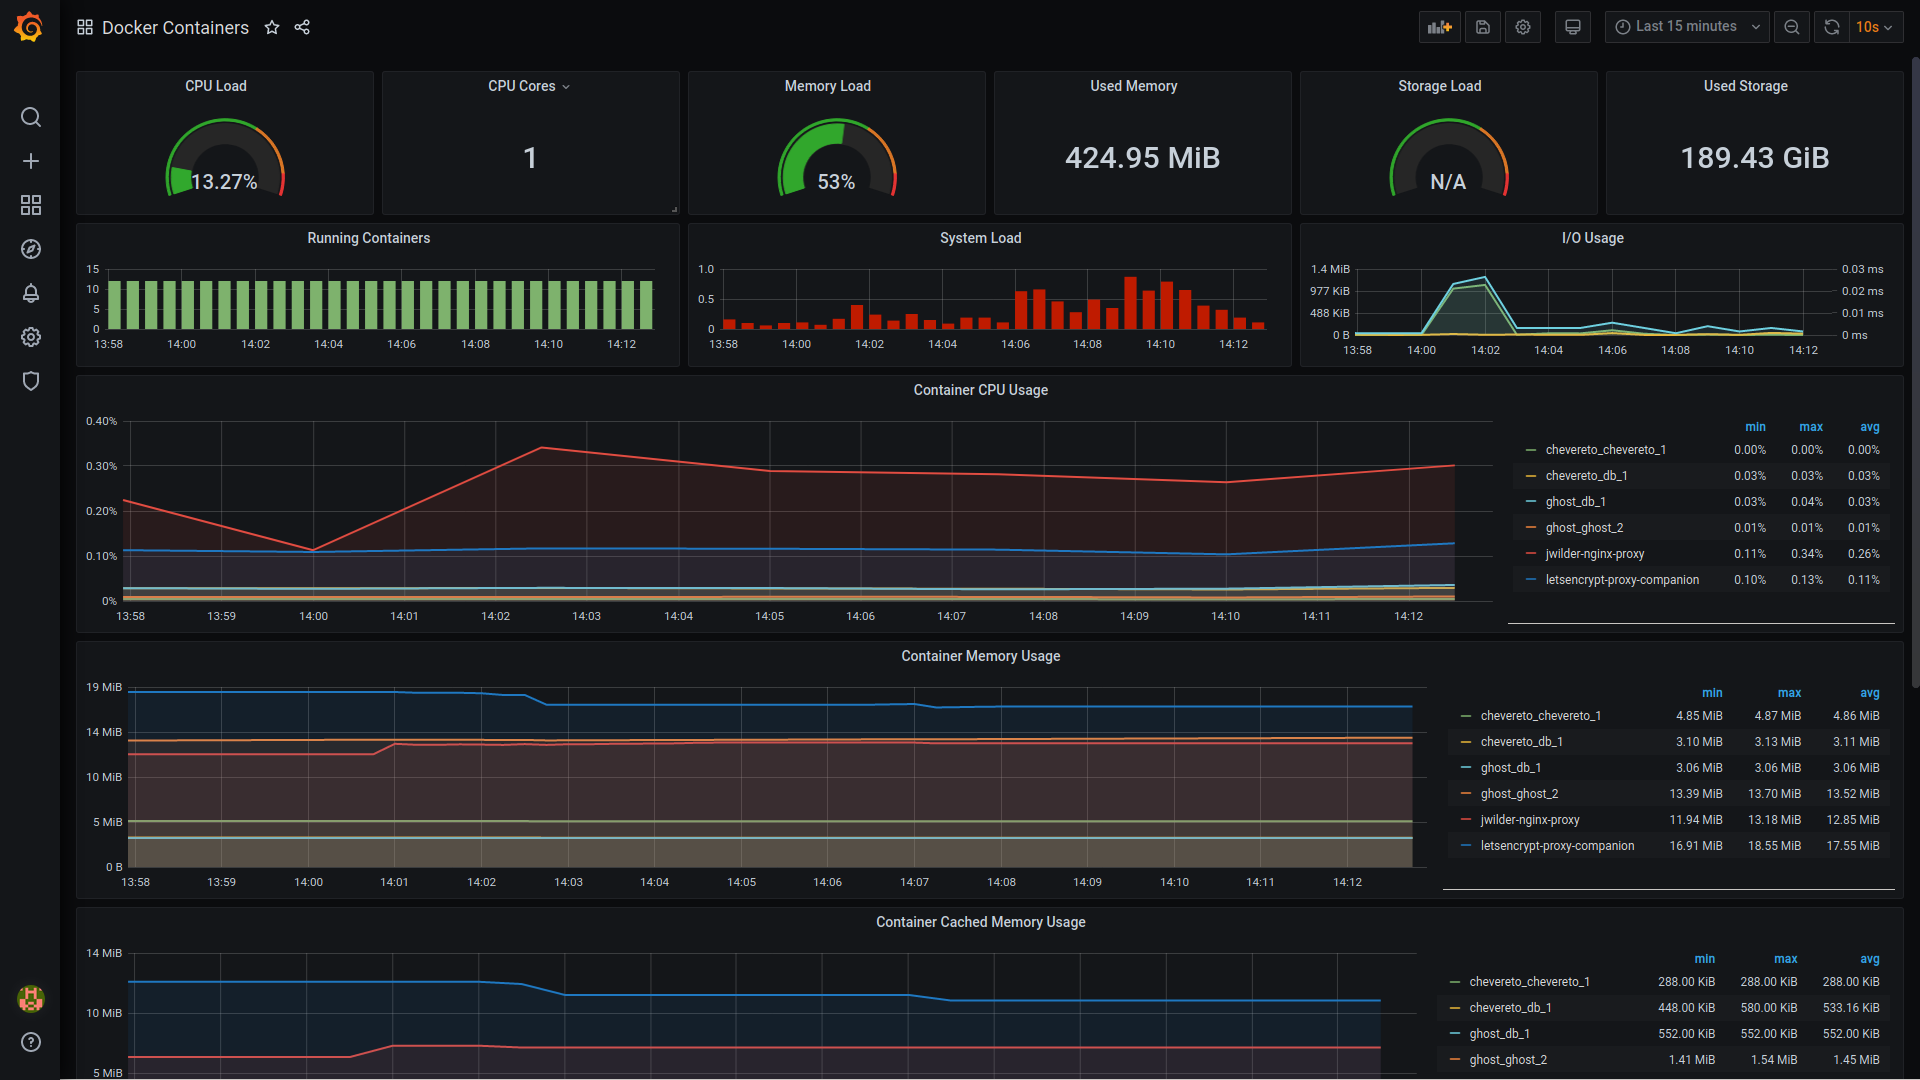
Navigate to the Grafana Dashboards Library and search for cAdvisor. Choose your preferred dashboard and copy the ID number. In our case, we'll use the Cadvisor exporter dashboard.

Paste the ID number on the Grafana dashboard and select Load. then Select our Prometheus server and import it.


Task-4:
Check the logs or Docker container names on Grafana UI.


Monitoring Docker container performance with Prometheus and Grafana facilitates real-time visibility and scalability, empowering users to customize dashboards and enable proactive responses to ensure optimal containerized environment performance. This integration offers a comprehensive solution for monitoring and managing Docker deployments with efficiency and precision.
Thank you for reading. 👍 Happy Learning😊😊
If you like this article , then click on 👏👏 do follow for more interesting 📜articles. Hope you find it helpful✨✨
Connect on 👉 chandana LinkedIn